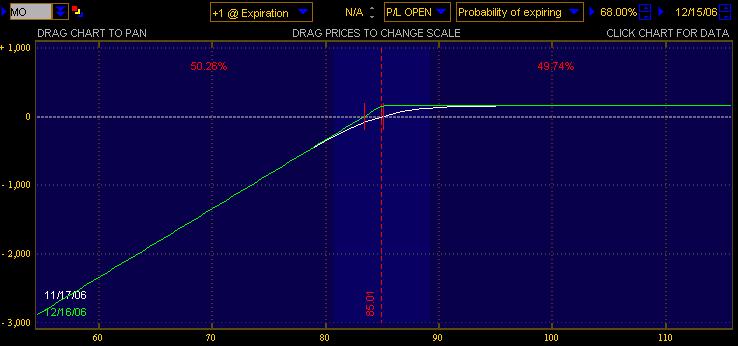
 MO covered call +100 shares at 85.15 and
sell 1 Dec 85c credit 1.85
See video in the learning section on how to read a risk graph, if u are not familiar with the tool.
Click on graph to enlarge.
sell 1 MO dec 85 put credit 1.5. Notice this is the synthetic equivalent of the covered call above.
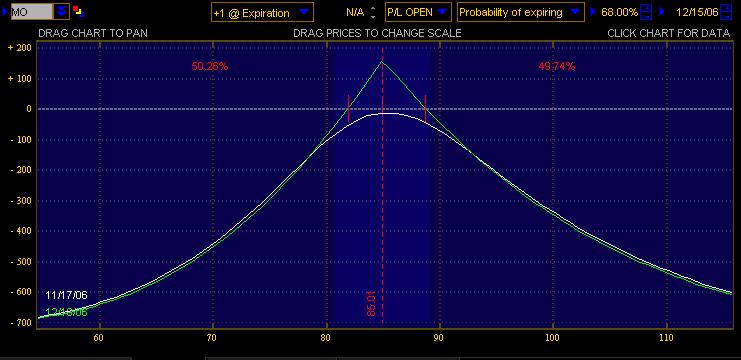 Long 1 MO jan09 85call debit 9.0
Sell 1 MO dec06 85call credit 1.85
This is a calendar spread. Note the difference in risk profile compared to the above two choices.
Risk graphs generated within Thinkorswim.
No comments:
Post a Comment