from CMATT
-------------------------------------------
OK now for my opinion on AAPL
there are many reasons i'm so bullish on AAPL, but I will just mention the main 2
#1 is valuation,and this what affects my opinion in the short term I feel the valuation on AAPL is way off at this time, I felt that way before the recent devalue in the PPS, which IMO was due to some funds who were short Read More...
Friday, December 29, 2006
Tom Preston: Trading resolutions for 2007
This is a transcript from a session Tom Preston at Thinkorswim did a few days ago. When TOS posts this transcript on Chat Archive I will remove this post. Mean while I felt this was soooo good that I post here in advance for anyone that misssed the session.
----------------------------------------------------------------------------------------------------------
Tom Preston: Trading resolutions for 2007
Tom Preston: 1) Don’t try to make back all your losses in one trade
Everyone makes losing trades. Sometimes you get the losers in a row, one after the other, and your account is smaller than when you started. You get frustrated and angry. You decide to take revenge on the market and make all your losses back and then some. So, the next trade you make, you increase the number of contracts or shares because your rage is overpowering your discipline and you’re sure that this trade will be “the one”.
And…you’re probably wrong. The trade turns out to be loser as well and your account is even deeper in the hole. Sure, it might be a winner, but it’s not worth the risk. Don’t let your anger control your trading. Just because you’ve had a string of losers doesn’t necessarily mean your due for a winner.
If you’re in the situation of having nothing but losing trades, a better idea would be to review your trading plan and see if there might be fundamentally wrong with it. Then you can correct it and see if that improves the results.
Tom Preston: 2) Don’t take stupid risk
This goes along with the first resolution. The bottom line is, don’t put your hard-earned money at risk unless you have a good reason to do so. To spin the old trading adage a little differently, if you have a hunch, DON’T bet a bunch. Keep your risk under control.
We suggest that you keep the max risk of any one trade to less than 5% of your trading capital. And keep the total risk of all your open positions to less than 25% or so of your trading capital. That means, if everything goes wrong, you won’t lose everything, and you’ll still have some money left to continue trading.
Also, having some kind of trading plan in place that gives you some consistent criteria for entering and exiting positions will help you put the trades you make based on “gut” feelings or something outside of those criteria in perspective. You can put those trades on, just don’t risk any more on them than you would your “criteria-based” trades, and maybe even less.
Tom Preston: 3) If it looks too good to be true, it is
I can’t stress this enough. I have been saying this since I started thinkorswim, and I find myself saying it again today. Option prices are not wrong. Now, I’m not talking about errors in the quote database. That’s a technical problem. What I mean is that if you see a box spread trading over the difference between the strikes, or a calendar spread trading for a credit, or an adjusted option trading for more than an unadjusted option on the same stock, with the same expiration and strike price, money is NOT lying on the floor just waiting to be picked up. Rather, it means that there is something else impacting those option prices like a dividend or something that you don’t see, but the pros do. The pros are right. It is a fact of the state of option trading that there are no arbitrage opportunities sitting there waiting for the retail traders (you) to take advantage of them.
Tom Preston: 4) Use spreads whenever possible
If you are trading directionally, that is, you are betting on a stock or index going up or down and you want to use options, please consider using verticals. Lately, I’ve been seeing a lot of customers betting on the direction of stocks or indices using simple long calls or puts. Now, I don’t have a problem with directional trading in and of itself. But long single options have sensitivities to time decay and volatility that can make a losing trade out of one that is right on direction. And if you’re buying in the money options, they usually have wide bid/ask spreads and can be less liquid than at the money or out of the money options, so that if you want to/have to exit the trade, you get lousy execution prices.
Verticals are great for when you are less than 100% confident that the stock or index will go in the direction you think it will. If you’re bullish, consider selling an out of the money put vertical. You make money if the index goes up, stays the same, or maybe even drops a little. If you’re bearish, consider selling an out of the money call vertical. Short verticals have positive time decay and less vega sensitivity than outright long options. Yes, their profit potential is less, but so too can be their max loss. If you don’t do too many of them (remember our suggestion of not risking more than 5% on any one trade?) they’re a good way of keeping risk under control.
Tom Preston: 5) Keep learning
Don’t stop trying to learn new things about trading, either by doing research, reading books and articles, coming to classes (try www.optionplanet.com), joining us here on Wednesday afternoons, calling the TOS trade desk with questions, etc, etc.
Everyone is getting smarter and more capable. The tools that we give you for free are more powerful than what I was using when I was trading professionally. You can learn things here no retail trader would have known certainly 20 and maybe even 5 years ago. The difference between the educated retail trader and the professional trader is getting smaller and smaller. That’s both good and bad for you. It’s good that bid/ask spreads are tighter now than they have ever been. You can see live quotes for free. But it also means that the industry is more competitive. Knowing what an iron condor is or how to calculate a roll value isn’t enough. There are hundreds of TOS customers who already know that stuff already. Making money trading is very hard work. You have to be willing to devote the time and energy to try to find an approach to trading that might actually make you money. A successful trading career isn’t built out of luck.
Wednesday, December 27, 2006
Sell your vested employee stock options!!!!!
Imagine u worked for a firm that granted you a s*** load of options that have become fully vested. Unfortunately for the time being they are under water. A pile of worthless paper? Maybe not for long!!!!!
Jadedbear from #options once related an attempt to low ball purchase employee stock options for cheap. Theoretically these non transferable options have ample time value left, even the under water ones. His attempt was unsuccessful but was an interesting idea. Soon, however, this may all change, starting with Google. Check out the skinny originally from The Wall Street Journal.
Jadedbear from #options once related an attempt to low ball purchase employee stock options for cheap. Theoretically these non transferable options have ample time value left, even the under water ones. His attempt was unsuccessful but was an interesting idea. Soon, however, this may all change, starting with Google. Check out the skinny originally from The Wall Street Journal.
Thursday, December 21, 2006
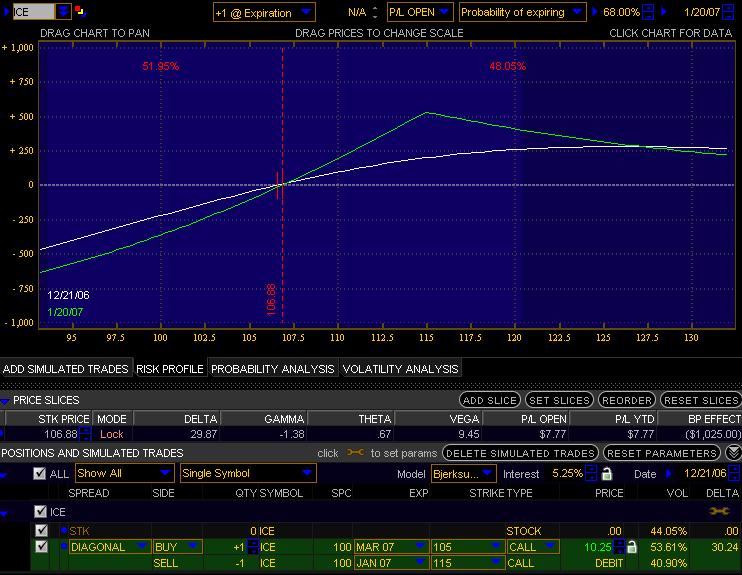
ICE position comparison
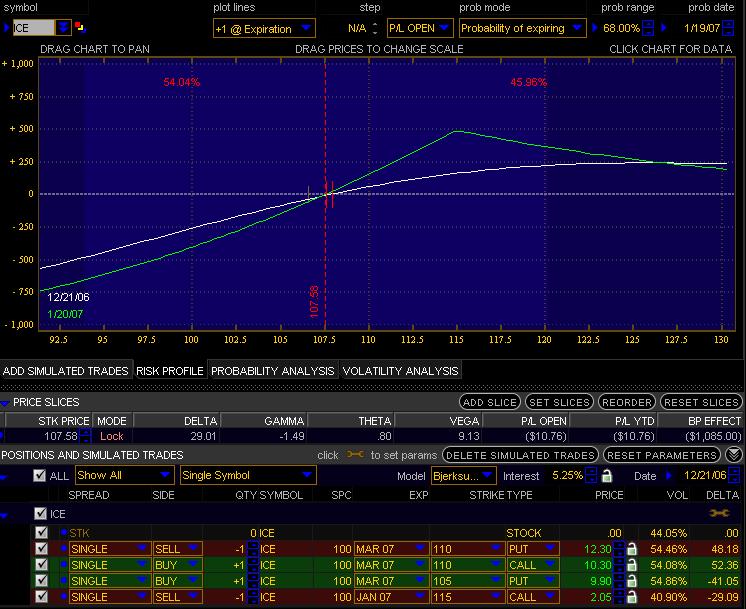
This post will demonstrate how a synthetic collar can be substituted with a simple diagonal spread, with less transaction costs. I saw this collar talked about in Woodiescciclub.com
------------------------------------------------------------------------------------------------
Synthetic collar.
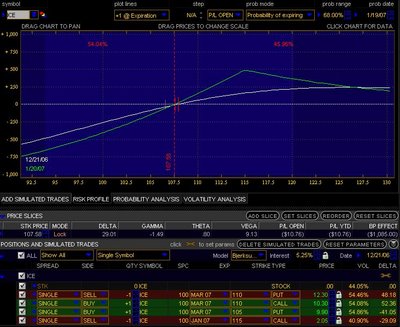 +Mar 110c
- Mar 110p
+Mar 105p
- Jan 115c
The 110c and 110p form synthetic long stock.
The synthetic long stock and the 105p form synthetic long call(with deductible). So essentially the position was deduced roughly down to:
+ March call
- Jan call
A long diagonal spread.
------------------------------------------------------------------------------------------------
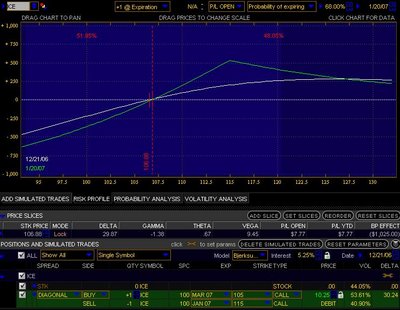 Here is the equivalent long diagonal spread:
+Mar 105c
- Jan 115c
debit 10.25
Only 2 legs to worry about, comparable greek risks, less commissions, less bid/ask spread to overcome, better breakeven point.
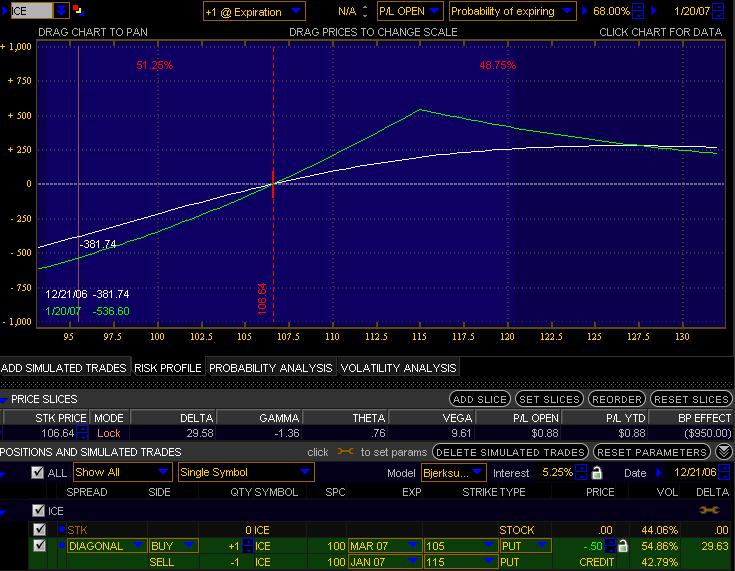
Debit is kinda high you said?
Compare its cousin using puts in the next position.
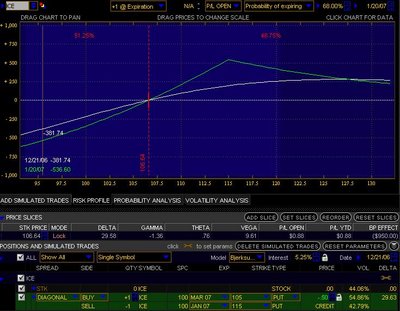
The ONLY difference in this position here compared to its "call" cousin above, its using puts, but essentially the same thing. Calls are puts, and puts are calls.
+ Mar 105p
- Jan 115p
credit .50
Which one of the three positions would you choose? ;-)
------------------------------------------------------------------------------------------------
Synthetic collar.
 +Mar 110c
- Mar 110p
+Mar 105p
- Jan 115c
The 110c and 110p form synthetic long stock.
The synthetic long stock and the 105p form synthetic long call(with deductible). So essentially the position was deduced roughly down to:
+ March call
- Jan call
A long diagonal spread.
------------------------------------------------------------------------------------------------
 Here is the equivalent long diagonal spread:
+Mar 105c
- Jan 115c
debit 10.25
Only 2 legs to worry about, comparable greek risks, less commissions, less bid/ask spread to overcome, better breakeven point.
Debit is kinda high you said?
Compare its cousin using puts in the next position.
The ONLY difference in this position here compared to its "call" cousin above, its using puts, but essentially the same thing. Calls are puts, and puts are calls.
+ Mar 105p
- Jan 115p
credit .50
Which one of the three positions would you choose? ;-)
TELK position comparison
 TELK - 17.11 (long) x 300
jan 25c - 2.05 (short) x 3
jan 15p - 3.30 (long) x 2
Total debit (at 50% margin) $2800 tied up(in a retirement acct it will be $5k+)
If stock went to 10 by expiration lose $1175
If stock went to 5 by expiration lose $1650
Max absolue risk $2000+
Max gain above 25 = $2322
slightly short vega -1.79
ROI against max risk 116%
ROI against dough tied up 82%
ROI against risk at stock going to 10 = 197%
ROI against risk at stock going to 5 = 140%
ROI against risk at stock going to 0 = 116%
 +jan 15c 3x -$510 ea.
-jan 25c 3x +$205 ea.
Total debit $915 amt of dough tied up
Max absolute risk $915
Max gain above 25 = $2085
flat vega risk
Max ROI against absolute risk 227%
ROI against dough tied up 227%
ROI against risk at stock going to 10 = 227%
ROI against risk at stock going to 5 = 227%
ROI against risk at stock going to 0 = 227%
Wednesday, December 20, 2006
Proprietary Trading audio archive posted
This post has expired, and the content removed at the request of the original producers of the archive, sorry. Expiration date 1/31/07.
Tuesday, December 19, 2006
How does delta and IV effect AGIX iron condor?
Just cut a video explaining how I see the effects are,
posted in the video section, named Delta+IV on iron condor.
posted in the video section, named Delta+IV on iron condor.
Saturday, December 16, 2006
Retail margin vs. Risk margin seminar archive now posted
It is now posted in the Learning video 
area, hot off the press session I did a
few hours ago. Please check it out.
area, hot off the press session I did a
few hours ago. Please check it out.
Wednesday, December 13, 2006
Titanium Collar??
I posted the details in my new message board for discussion. It appears to be a way to protect long stock position thru news by turning it into a long straddle with very little additional cost.....
Monday, December 11, 2006
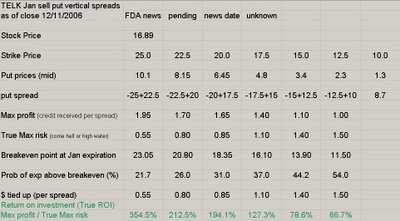
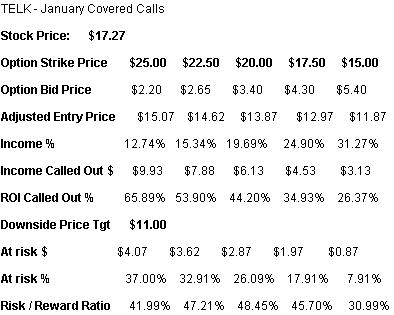
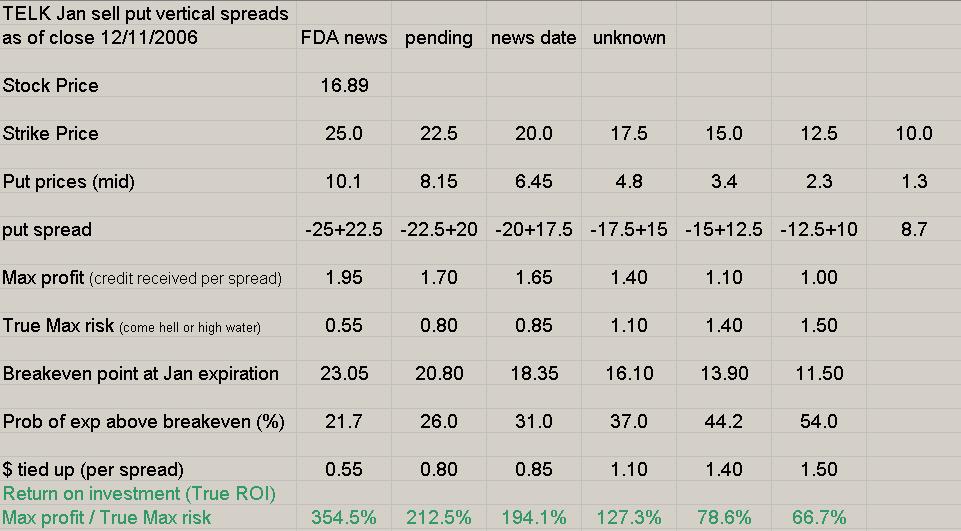
TELK FDA play covered call vs bull put spread
Andy from InvestorVillage proposes the following covered call table for consideration, on TELK. You can read the reasoning behind the numbers from Andy's post at InvestorVillage .

---------------------------------------------------------
Here is one of many alternative ways to skin the same cat. Click on pic to enlarge.
Comments welcome.
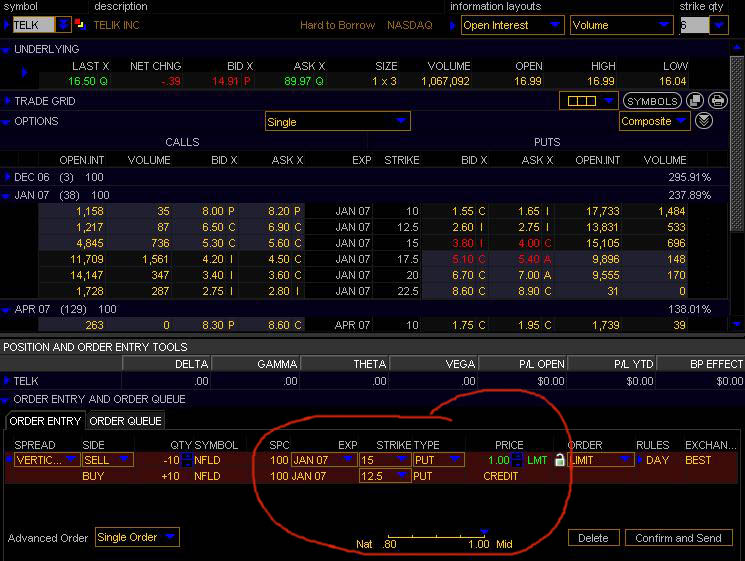
Sample order entry screen on Thinkorswim

---------------------------------------------------------
Here is one of many alternative ways to skin the same cat. Click on pic to enlarge.
Comments welcome.
Sample order entry screen on Thinkorswim
Saturday, December 09, 2006
Married put vs call video clip posted
This 6 minute video is now posted in the video section to the left.
It attempts to explain why long stock + put is really the same as long call of the same strike.
Your scrutiny is welcome.
It attempts to explain why long stock + put is really the same as long call of the same strike.
Your scrutiny is welcome.
Dan Sheridan CBOE webcast, a must see!!!
I have been watching Dan's free webcast series at the CBOE Learning Center and am plugging the series here.
The two topics that stand out the most in my mind (I am about 75% thru the series) are:
How to pick good calendar spared candidates and why large skews may be a bad thing?
How to creatively adjust your vanilla iron condors or butterflies? (in ways that I have never thought of before)
To pick up the rest of the golden nuggets......u will have to view the series yourself. Even if u are a seasoned trader, the guy is a riot to watch, he is a natural in front of the camera.
Registration is all free at the CBOE Learning Center.
Oh, if u see Dan ask him if I can get a free mentoring course for myself ;-)
Thursday, December 07, 2006
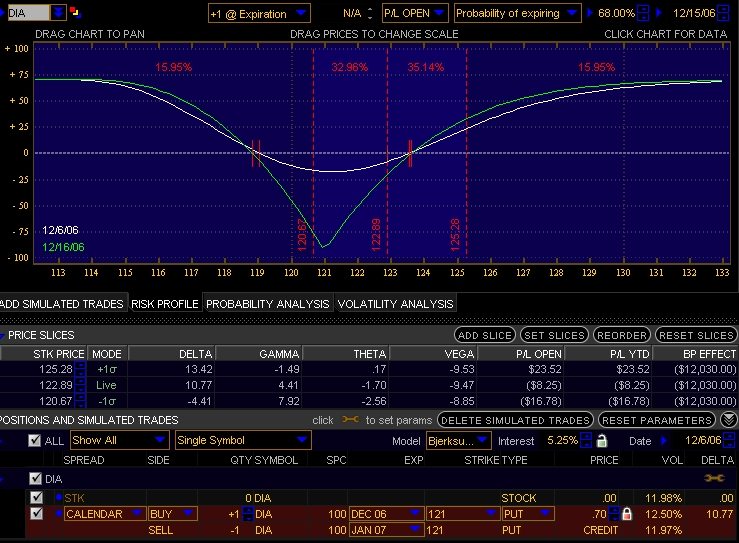
DIA Reverse Calendar example
Q:
my broker (www.thinkorswim.com) offers the possibility to view what
trades other customers enter and today (December 6th) someone entered
sell Jan 121 DIA put
buy Dec 121 DIA put
for a credit of 70 cents when DIA is at 123. Apart from the fact that
he might want to exit a position, let's assume he is opening this
position. Now I wonder, what is his rationale here?
In 10 days the December option is expired and he will be short the
January position. Anybody having an idea what this person is up to?
I guess if the market goes up, then he can buy back the short put
cheaper, but is that it?
thanks, gis
P.S. Many thanks to Ricky and options junky for answering my question
about the back ratio spread and the charts junky!!!
-------------------------------------------------------------
A:
Its quite possible, as others have pointed out, this could be a part of a larger order or a rolling order. But suppose its an order to open a lone position, this is the risk profile, note how much margin is required, why is that?
A seemingly low risk looking risk graph above with large margin requirement is partly due to its vega risk. When the position is short volatility, an increase in IV hurts the overall position. In theory there is no ceiling on how high IV can go, thus the large margin. The other risk to the clearing firm is when the front month expires and the retail trader does nothing to terminate or cover the short jan leg.
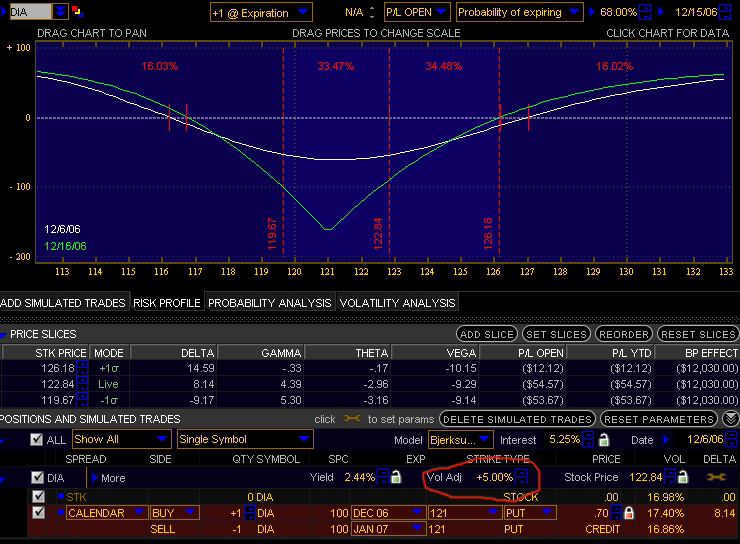
The graph below simulates a 5% increase in IV overall, note the max risk and breakeven now.
my broker (www.thinkorswim.com) offers the possibility to view what
trades other customers enter and today (December 6th) someone entered
sell Jan 121 DIA put
buy Dec 121 DIA put
for a credit of 70 cents when DIA is at 123. Apart from the fact that
he might want to exit a position, let's assume he is opening this
position. Now I wonder, what is his rationale here?
In 10 days the December option is expired and he will be short the
January position. Anybody having an idea what this person is up to?
I guess if the market goes up, then he can buy back the short put
cheaper, but is that it?
thanks, gis
P.S. Many thanks to Ricky and options junky for answering my question
about the back ratio spread and the charts junky!!!
-------------------------------------------------------------
A:
Its quite possible, as others have pointed out, this could be a part of a larger order or a rolling order. But suppose its an order to open a lone position, this is the risk profile, note how much margin is required, why is that?
A seemingly low risk looking risk graph above with large margin requirement is partly due to its vega risk. When the position is short volatility, an increase in IV hurts the overall position. In theory there is no ceiling on how high IV can go, thus the large margin. The other risk to the clearing firm is when the front month expires and the retail trader does nothing to terminate or cover the short jan leg.
The graph below simulates a 5% increase in IV overall, note the max risk and breakeven now.
Wednesday, December 06, 2006
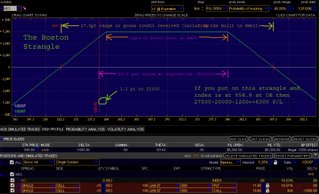
The Boston Strangle - from SFO mag
There is an interesting article in the Dec 06 edition of the SFO Mag on something called The Boston Strangle. Subscription is free.
I read the article initially and was graphing out the strangle playing with the numbers.
short 10x XEO 560 calls debit 15.6 each
short 10x XEO 580 puts debit 11.9 each
For more details and reasonings behind The Boston Strangle, you will have to subscribe and read the article ;-)
What I discovered was a discrepancy of the P/L if XEO expired at 558.8. The published P/L, $5380, and what's shown on my graph did not jive (I used thinkorswim). Not satisfied at such seemingly simple math, I graphed using Hoadley. TOS and Hoadley both showed $6300 profit.
A much more alert reader, Tom Opiela (photoman), pointed out where the problem is. A picture beats a thousand words. Click on pic to see full version.

Tuesday, December 05, 2006
20x INFY DEC 55 ATM puts, 10 days to expiration
Q:
I have 20x DEC 55 PUT bought at $1.25.. have only 10 days or so... need
some advice in terms of how to reduce the risk..bec. the stock is
already about $55.. should I close it.. or get some call to cover the
risk. Stock is up and down it was 52 three days back and now
55... stock pattern looks strong its going to swing based on the market..
but if u look at the PE its more than 46 times and doubled in last 4 month
after the split.
My thought when I bought the unit is to use the volatility to make some
money.. went to 55 from 53 in two days on average volume...
Would really appreciate any thoughts.
-------------------------------------------------------------------
A:
 Time decay is against you in these last few days of the expiration cycle. At 20x u are losing roughly $90 per day just on time decay.
If stock stays above 55 by expiration u will lose the whole thing.
If you are long term bearish and must pick tops in rallies like this, at least buy longer term options where the time decay is dramatically slower. Look to jan or apr perhaps.
Here is the risk profile of your position, click on pic to see larger. See my video, how to read a risk graph if having trouble.
Here are some additional thoughts:
If the weather forecast is sunny, yet its actually starting to drizzle outside, which do you believe?
If the drizzle turns into light rain, what do you do?
If light rain persists for several hours, do you stick with the original sunny forecast or prepare accordingly when heading outside?
Monday, December 04, 2006
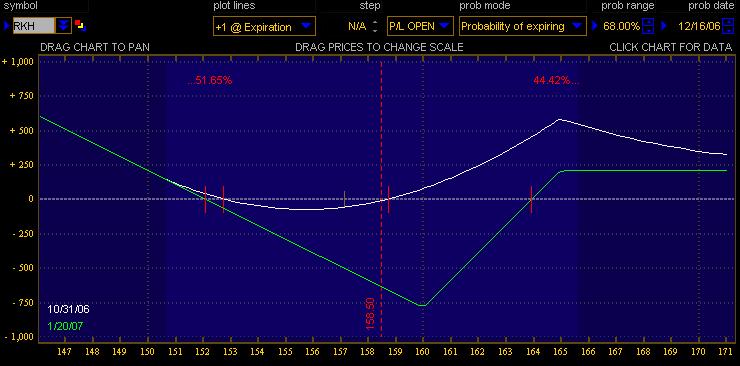
RKH ratio back spread
This question was originally posted on optionstradingcoach yahoo group.
------------------------------------------------------------------
Hello,
about 2 or 3 weeks ago I put on a ratio back spread on RKH. At that
time RKH was at around 158.50
So I sold 2 January 165 puts and bought 3 January 160 puts for a
credit of 2.10
A few days ago, with RKH at around 156, this position still had a
loss, if I had bought it back. Don't understand why, seeing that the
underlying had gone in the right direction more than 2 bucks.
Yesterday I got exercised on my short puts, so I then exited the
whole position, but the question remains.
Many thanks, gis
P.S. There is a chance that when I checked my position that I
actually made a mistake and I already had a profit, but am not sure.
P.P.S Sorry for not being able to provide more accurate numbers. I
need to improve my trading diary.
P.P.S The difference in IV when entering the spread was about 36 for
the long puts and 35 for the short puts, so don't think that was the
reason.
-------------------------------------------------------------------------
Hi gis, (click on pic to enlarge)
 Here is your original risk profile, I estimated the entry date a few weeks back when u first put on the position. This is very much a long vega position with a large or quick move being the index sentiment.
See my video "how to read a risk graph" if the pictures are gibberish to you.

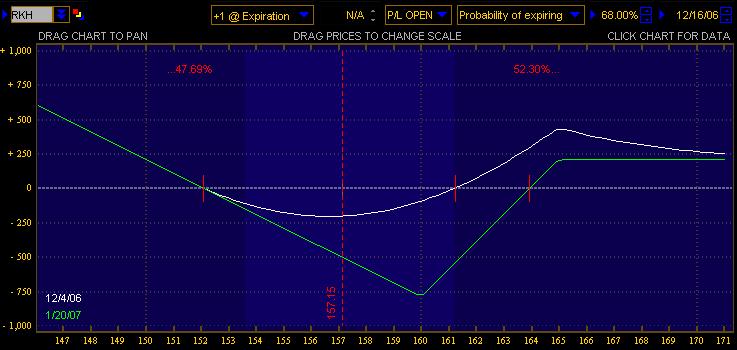
Here is your risk profile today (assuming no assignment). Note the stock has not moved and decay is eating away at the white line.
Graphs created using Thinkorswim.
Frankly with the vol and price characteristics I would be inclined to do neutral calendars on this since it does not look like a mover to me.
------------------------------------------------------------------
Hello,
about 2 or 3 weeks ago I put on a ratio back spread on RKH. At that
time RKH was at around 158.50
So I sold 2 January 165 puts and bought 3 January 160 puts for a
credit of 2.10
A few days ago, with RKH at around 156, this position still had a
loss, if I had bought it back. Don't understand why, seeing that the
underlying had gone in the right direction more than 2 bucks.
Yesterday I got exercised on my short puts, so I then exited the
whole position, but the question remains.
Many thanks, gis
P.S. There is a chance that when I checked my position that I
actually made a mistake and I already had a profit, but am not sure.
P.P.S Sorry for not being able to provide more accurate numbers. I
need to improve my trading diary.
P.P.S The difference in IV when entering the spread was about 36 for
the long puts and 35 for the short puts, so don't think that was the
reason.
-------------------------------------------------------------------------
Hi gis, (click on pic to enlarge)
 Here is your original risk profile, I estimated the entry date a few weeks back when u first put on the position. This is very much a long vega position with a large or quick move being the index sentiment.
See my video "how to read a risk graph" if the pictures are gibberish to you.
Here is your risk profile today (assuming no assignment). Note the stock has not moved and decay is eating away at the white line.
Graphs created using Thinkorswim.
Frankly with the vol and price characteristics I would be inclined to do neutral calendars on this since it does not look like a mover to me.
Sunday, December 03, 2006
Calendar spread pow wow tonite 12/4 at 8pm pacific
I am going to do a short, basic session on calendar spreads (15 to 20 min) then open up to questions.
The conference software will be www.yugma.com. Conference ID 83170611 or click here. No registration is necessary. There is a small java plug-in that gets installed automatically for the first time.
I am seeing that it works with IE better than Firefox. Two monitors are best, as u can maximize the shared desktop on one screen, and move the chat blocks onto another screen. Voice is done via conf call number shown on the top of the chat box. Long distance charge may apply. Not sure how skype would work in this case.
junky
lyn.express@gmail.com
skype: optionsjunky
Yahoo IM: optionsjunky
Friday, December 01, 2006
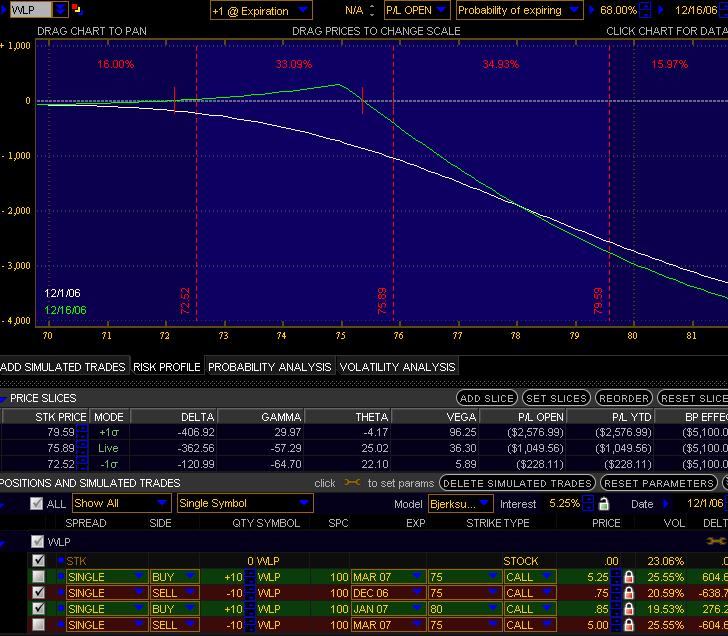 Q:
Q:+ mar 75c -5.25 debit
- dec 75c +.75 credit
+ jan 80c -.85 debit
- mar 75c +5.0 credit
My bias is the stock (WLP goes back to 74 by expiration) What should I do?
A: this is not a great position to be in even if you are convinced the stock goes back to 74. The credit received for the dec 75c was small, offering the trader little buffer against an upside move. The upside jan 80c (protection) is a whopping 5 pts away. This position is also taking on hard delta, meaning the short is ITM and the delta growing more than 2x as fast as the long leg if this trend persists.
For 10 spreads if stock goes back towards 75 u have a chance to breakeven on the whole thing. But, if we expire at 80, $3k loss.
Not a great risk reward trade.
I would say if one is absolutely convinced at the 74 bias, at least reduce the position by 1/2 immediately. Ask yourself this question, If I had no position in WLP right now, would I short 340 shares of stock? (delta exposure of current position sized at 10 spreads).
Thursday, November 30, 2006

Monday, November 27, 2006
Bond options
This was originally posted in the advancedoptionstrategies group, by Stall Horn.
------------------------------------------------------------------------------------
James Bond, that is...!
Greetings friends,
Did you know that the hugely successful James Bond cinematic franchise, as
we know it today, all started with a call option? Read More....
----------------------------------------------------------------------------------------
Additional info can be found Here and Here.
Here is yet another example of a bond film with options mixed in.
Saturday, November 25, 2006
Quick tip on options pricing estimation
Q: I bot some GOOG March 600/620 bull call spreads debit 2.6 each, anticipating the stock moving higher. Goog is currently at 505. How do I know what that spread will be worth if the stock moved quickly to 530 within a week's time?
A: There are several ways to do this. I'll use a single option as an example as its easier to visualize for newer folks. Same steps for spreads pricing. (please also see the valuable comment posted by Ben Evans, at the bottom of this post)
If I bot the jan07 550c for 7.7 and I wanted to know roughly what that option is worth (not counting effect of IV) if GOOG moved up by 20 pts quickly (say within a day or two) there are several ways to do this:
1. Use an options calculator found at many websites and tools. Here is the one I use http://www.ivolatility.com/calc/ or
2. use a risk graphing tool such as the one built in on thinkorswim or hoadley.net or 888options.com. The graphing method is nothing but a giant, sophisticated options calculator, plotting all the results.
or
 (click on pic to see larger version)
3. look at the strike thats 20pts lower on the jan 07 chain, specifically in this case the jan07 530c (12.9ish as of this writing).
That is what the 550c will be worth if goog moved up 20pts quickly.
The same is true if u wanted to know if goog moved down 20pts, just look at the strike 20pts higher, in this case the 570c and that will give u a rough guesstimate.
Thursday, November 23, 2006
check out Options Trader mag
Absolutely free monthly online publication if u have not checked it out already.
In the current Nov issue I particularly enjoyed:
- Trading Tips from an options market maker
- CME, CBOT join forces
- Nasdaq enters croweded options field
Where its also free, is my new Forum along with my stock buddy cmatt. Please come by with your questions and comments.
Tuesday, November 21, 2006
IWM choices
 Q:
Q:I entered 3 Mar IWM 78 puts today at a cost of 2.85 per option. I have a stop at 2.45 which correlates with a new high for IWM based on OX
option pricer. I have contemplated selling OTM puts (either Dec or Mar - maybe 74s) on IWM and making a spread out of the trade. What action would be recommended on this trade? Leave it and move the stop down if gains are made or convert to a spread trade?

Here is the risk profile if selling 3 dec quarterly 74p for merely .30 each.
Click on image to enlarge.

Risk profile if turning it into march vertical spreads by selling Mar 74puts. The problem with this long dated vertical spread is the delta implications.
See my video on ANF vertical spread answered for explaination.
All risk graphs created with thinkorswim.
Sunday, November 19, 2006
How to protect my stock with long put?
Q: I have SBUX stock that has appreciated significantly since I bought it three years ago. I read McMillan book and it recommends that buying very long term (like two-yrs LEAPS) put option is the best strategy to protect a long stock position from loss, but it didn't go into much details about how out-of-money should such a put be. Do you guys have any experience of doing this? Thanks!
A: leap put in your situation would be like buying insurance for say your car. How much value do you want to protect against loss and for how long, and what kind of deductible are u willing to take on, those are the 3 main deciding elements (not considering implied volatility).
For example, if u bot 1 jan09 35 strike put (800 days) u have the right to sell 100 shares of sbux at 35, no matter how low sbux went. So u are saying u have protection from 35 on down, with a $2.33 per share deductible (current closing price minus 35, assume stock at 37.33) , for 800 days.
 But wait, that insurance contract will cost you $400, so 35 less 4pts is 31. Your real protection at jan 09 expiration is really 31 on down. So refer to the options chain and pick the choice that best suit your needs, based on the simple rules I have outlined above.
Click on image to see original size and details. Risk Graph created with Thinkorswim.
OT: not the same o same o breakfast
 Tired of the same o same o breakfast? Try the following:
Shrimp Sandwich (right) - Served open faced on rye bread topped with hard boiled egg, cold water shrimp and mayonnaise.
Complete breakfast, includes coffee (top).
Fresh cinnamon roll (left).
Holiday cold plate (bottom) - A sampling of Swedish items. Featuring meatballs, ham, gravad lax (salmon), egg and shrimp. As always, click on picture to enlarge.
All for 10 bucks at my local IKEA cafe, easily fed 2 adults and 2 youngsters, right inside the IKEA store. I cant find any info on their website at all regarding their onsite cafe but I would highly recommend a visit if u are kinda tired of the same o same o.....
Click here for a store near you.
Friday, November 17, 2006
Nymex IPO
My own dear brother wants to play the NMX IPO and we had the following actual discussion. I will make and post a short video clip illustrating the ideas this weekend.
--------------------------------------------------------------------------------------
----- Original Message ----
From: junky
To: bro
Sent: Tuesday, November 14, 2006 7:50:21 PM
Subject: Re: Can we buy some Nymex?
whats the press release say they expect to open at?
---- Original Message ----
From: bro
To: junky
Sent: Wednesday, November 15, 2006 12:06:43 AM
Subject: Re: Can we buy some Nymex?
Question:
Is there a way to put a buy order in to accomplish the following logic? I want to buy 150 shares, but I don't want to pay more than $72/share. If I put in a limit order at $72, then it won't buy until it hits that point. But if I put in a market order, then who knows, it might finally execute at $102/share with some trader screwing me because market order = blank check?
These choices seem clumsy and very limited. Is there a better way?
---- Original Message ----
From: junky
To: bro
Sent: Wednesday, November 15, 2006 12:34:01 PM
Subject: Re: Can we buy some Nymex?
ok depends on what NMX opens at on Friday, limit orders guarantee min. buy price but not execution.
Market order guarantee execution but not price.
For your 72$ example, if there are options for NMX, which I doubt for an IPO, what u can do is sell puts. Say u are bullish on the stock and u dont mind owning shares at a lower price, u can sell a 30 day 70 strike put and collect $200 per contract (pulled number out of the hat).
What u are saying is u are willing to buy 100 shares of stock at 70 less the $200 u collected. so in the end of the contract period if stock was anywhere below 70, u agree to buy 100 shares at 70, subtract the 200 u got for the put, effectively buy it at 68. If stock was anywhere above 70, no stock is to be purchased and u keep the $200.
The other thing good about this put contract (selling cash secured put, or selling naked put) is that time decay is on your side. U don’t need to wait 30 days to profit from this. Time is ticking away in your favor on that put that u sold. Even if stock say at 72, didn’t move for 2 weeks, that put would have decayed some, and maybe u can terminate that contract by buying that put back for say 150, ending your obligation to buy stock, and pocketing $50.
We can even discuss selling put spreads, which IMO is much more risk averse than selling puts alone, and ties up alot less cash.
Wednesday, November 15, 2006
three choice comparisons
 MO covered call +100 shares at 85.15 and
sell 1 Dec 85c credit 1.85
See video in the learning section on how to read a risk graph, if u are not familiar with the tool.
Click on graph to enlarge.
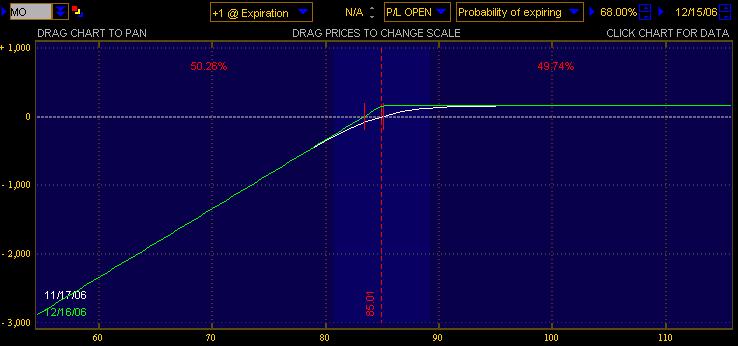
sell 1 MO dec 85 put credit 1.5. Notice this is the synthetic equivalent of the covered call above.
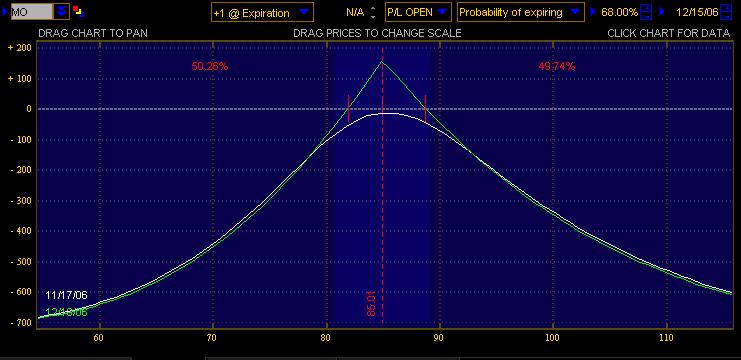 Long 1 MO jan09 85call debit 9.0
Sell 1 MO dec06 85call credit 1.85
This is a calendar spread. Note the difference in risk profile compared to the above two choices.
Risk graphs generated within Thinkorswim.
KOSP Tender Offer by Abbott
CBOE research circular dated 11/22/06. This explains the best I think.
KQW is the current options series
All current SEC filings for KOSP
KQW is the current options series
All current SEC filings for KOSP
Monday, November 13, 2006
Yet another way to trade!!!!
My trades by Michael Catolico - excerpts from a message response to
others in compoundstockearnings yahoo groups.
The thread is titled "bunch of stuff" posted on 11/12/2006.
-------------------------------------------------------------------------
i don't approach the markets the way i've been challenged here. i don't
enter a position by finding "a good stock" then tossing on a few options
to enhance that investment. i trade reactively to the markets in a
dynamic, provisional way. i do everything i can to NOT have an opinion
on what a stock or the market will do. with every trade i essentially
enter it randomly, completely neutral and assuming the trade will fail.
then i try to extricate myself from the mess i've gotten myself into and
somehow make money with it. i've been an active participant in many
discussion groups and have worked through and discussed many actual
trades - winners and losers - i've made. but mostly the point has been
to illustrate some principle or other that i've learned and not to show
someone "how to trade like me." i'm not going to toss a trade out there
just to show how good or bad i am. what's the point of that when i
consider that success lies with the individual trader and has nothing at
all to do with the strategy or advice behind it. if i say buy abcde
stock someone could follow that or take the opposite position. either
way, it's not the original opinion that makes the money. it's what's
done with the trade that counts. both traders could win or both could
lose following or going contrary to my "advice." unless they follow in
lockstep with each of my moves, the winnings or losses experienced would
have nothing to do with me.
folks on this list give a lot of their research and work effort. some
might find some poster's theory about a stock's technical momentum or
fundamental value of some use. what i offer is a sober look at risk. if
people don't find that perspective of any value it's easy enough to
simply hit the DEL key on any of my messages.
AAPL example

Trader buys ITM AAPL 75c debit 9.45.

Stock moves up to 85, sell 81 shares of aapl to make it delta neutral and limit risk at expiration.
Sunday, November 12, 2006
Does this really benefit online options trading??
This is a follow up to Major options announcement from a few days ago.
More details on the SEC margin ease proposal
and
what it really means to the small retail traders.
Its buried in section 3. SEC Moves to Abolish Margin Calls.
Also read the Broker-Dealer "Friendly Reminder Call" transcript, just below it.
Official NYSE memo.
More details on the SEC margin ease proposal
and
what it really means to the small retail traders.
Its buried in section 3. SEC Moves to Abolish Margin Calls.
Also read the Broker-Dealer "Friendly Reminder Call" transcript, just below it.
Official NYSE memo.
Saturday, November 11, 2006
No man is an island
Frequently this type of question comes up from the newer folks:
When I trade the QQQQ the bid/ask spread is typically .05, but when I look at SPX/NDX/RUT the bid/ask spread is quoted in whole dollar, why would anyone trade the larger indices?
"A 3pt move in the NDX or MNX is quite a different story as a 3pt move in the QQQQ" an experienced trader once related to me. "You have to compare apples to apples, in relative terms". Lets see how.
The table values were constructed using after hour quotes as of the close on Friday 11/10/06. Basically comparing apples to apples in % terms.
 Also consider transaction costs. If u had a set amount of say $5000 blocks to deploy in the Nasdaq index, how many commissions would you have to pay using the Qs? How many commissions would you have to pay using the MNX or NDX?
Amen for ISE challenging CBOE for their proprietary products to be multi-listed. See full article here.
I remember the week NDX went from trading on CBOE only to trading on multiple exchanges and the spread dropped by 2/3.
When is someone gonna sue PHLX for XAU to be opened up ;-)
Just as No man is an island, entire of itself; every man is a piece of the continent, a part of the main, no options exchange can be on its own for every long ;-)
Thursday, November 09, 2006

Wednesday, November 08, 2006
OT: Chained to the ......
 I was out sick today from work so I watched a bit of day time TV. I channel surfed and ran into The Rachel Ray Show . I turned around and typed in one of the chat rooms that Rachel Ray is on CBS and she is cute. One of the chatters inquired if I was still married. "I am married but not dead", I typed. My buddy jp promptly announced to the room:
Just because you are chained to the dog house does not mean you cant bark at the cars going by!!
Priceless jp, priceless.
Major options announcement (from Sept)
no affiliation with options university, informational only:
Click to view short video.
Additional info on Nasdaq options market.
Click to view short video.
Additional info on Nasdaq options market.
Sunday, November 05, 2006
EXPE skew case study

EXPE low historical vol vs. high front month IV. 17% skew between nov/dec.
EXPE will do their numbers 11/9.

Sample nov/dec itm 15call calendar debit .25.
The expectations is that the front month will revert back to the mean (-17%) while the back month contracts a mere 3% vol.
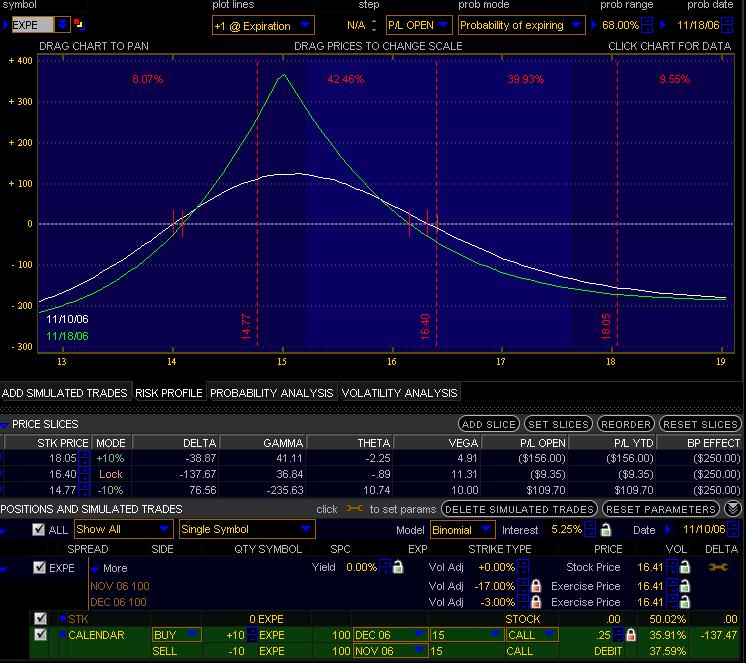
Here is the spread after the -17% and -3% simulated.
Risk graphs created with Thinkorswim.
 This is what happens after a vol crush post news. This risk profile is taken 1 hour b4 Friday's (11/10) close. Quite different than the hypothetical posted a few days ago eh?
Front month vol 39.53
Dec vol 29.76 both on the itm 15calls
Saturday, November 04, 2006
NVDA collar

Someone from InvestorVillage posted a NVDA collar trade:
long 100 shares of stock - $33.95
Sold Nov 32.5 Call - $ 2.65
Bought Dec 30 Put - $ 1.05
Margin required: $3000+
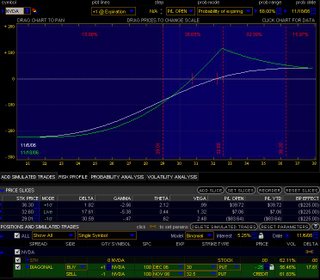
The covered call portion (long stock-nov call) is a synthetic equivalent to a short naked put. Thus the whole collar is the same as a nov/dec diagonal spread:
-nov 32.5p
+dec 30p
Margin required: $225
NVDA will announce their numbers, Nov 9th.
Margin required: $3000+

The covered call portion (long stock-nov call) is a synthetic equivalent to a short naked put. Thus the whole collar is the same as a nov/dec diagonal spread:
-nov 32.5p
+dec 30p
Margin required: $225
NVDA will announce their numbers, Nov 9th.
Friday, November 03, 2006
Love is grand, but divorce is.......
Guy across the street, moved in about a year ago with wife and 2 little ones. Recently we don’t see the wife and 2 little ones anymore. My girl found out from neighborhood gossip they are in divorce proceedings. We then deduced to the following scenario (complete speculation):
Just b4 they moved in, the guy's Dad died of old age in that house and son inherits the place. Wife prolly served the paper at that opportune time shortly there after.
Love is grand, but divorce is 100 grand (depending on what part of country u live).
Along that line of thought, this is one of the most entertaining Radio Show, IMO.
Tuesday, October 31, 2006
RUT Iron Condor

Here is a RUT IC posted by a fellow trader from
Advanced Options Strategies. Hi probability trade given the limited credit. I have asked for his exit/adj plans and will post details as I get them.
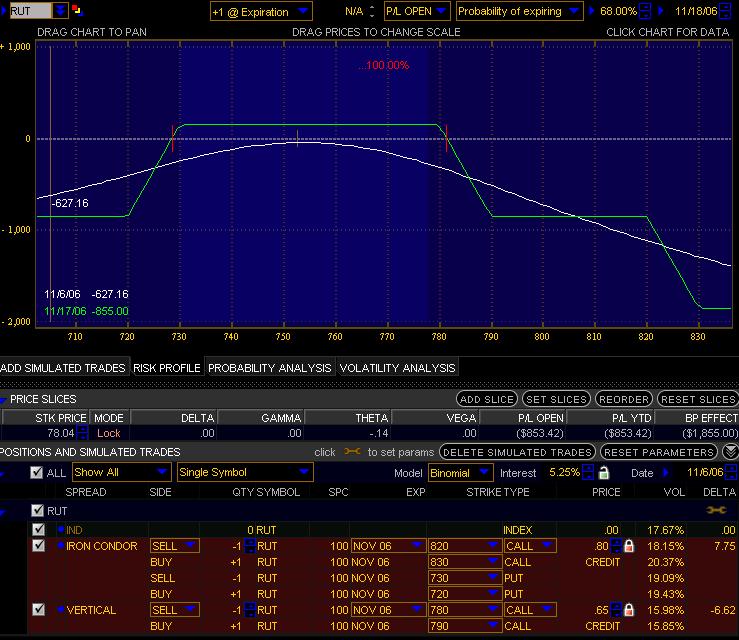
11/3/06
The trader added the nov 780/790c spared for .65 credit, citing multiple resistance zones between the current price and 780, with 780 being the last resistance point.
Note how the profit zone narrowed with this maneuver and risk is increased on the extreme upside.
AVNR news out
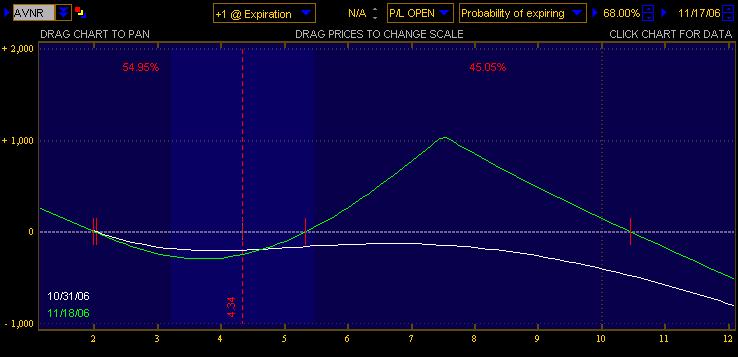 This thing was crazy as expected. I got up all groggy pre-market only to watch it gap open in the 12s and tank like a lead balloon. I had intended to short stock at 8 ish but had to chase it down to 7s b4 I got filled 300 short shares avg 7.0. Vol crushed as expected. Resulting position shown. Covered all short stock at 4.23 avg. Unwind the original diagonal for 2.1 debit. Total loss including costs -.35
Sunday, October 29, 2006
Pismo Beach weekend
 Spent the weekend south of me visiting a long time friend and her family. At Pismo Beach we went to Mo's Smokehouse BBQ and saw these pigs on surf board displays in the eatery ;- ) Pretty good stuff. The folks at work will definitely feel the power of garlic fries come Monday.
Mo's Smokehouse BBQ
Saturday, October 28, 2006
OIH case study for OCT
This case study was posted elsewhere in OCT, I am moving here to my own blog. A trader came to me with the initial position, after a substantial move. Click on each picture to see larger view. If the pictures seem fuzzy, try zooming it in your browser window by single clicking on the larger pic. See my newly available "How to read a Risk Graph" video in the video section.
-----------------------------------------------------
8/23 initiated 10x OCT OIH SS (iron butterfly) 130/140/150 credit 7.6 then went to sleep.

-----------------------------------------------------
8/23 initiated 10x OCT OIH SS (iron butterfly) 130/140/150 credit 7.6 then went to sleep.

Woke up on 9/25 and OMG OIH is all of a sudden the low 120s!!!
Panic/paranoia/anger/hope/fear/greed all
set in at the same time. Not to mention the continued
pressure to make $$ regardless of timing.
Luckily the trader immediately took off 50% of the position
to cool his head so as to be able to plan out further action
in a more calm mental state of mind.
2nd action, buy to close the short 5x 140c debit filled for .45 each.
The 140c strike was originally sold for 6.8 each. The reason for
the buy back is that the 140calls have depleted 93% of its max
available value, and OIH is deemed capable of bouncing around
quite a bit. Placed limit orders to re-sell the 140c strike if it
reached 1.2 (roughly a 5pt bounce) seemed fairly possible.
Max risk $1425, breakeven at expiration, 133, 9 pts away from
the current 124 closing.
The resulting risk profile is shown below.

9/26 Proposed action, buy back the 140/130p spread to close and
sell the 130/125p spread to open as an unbalance butterfly order
125/130/140p, current market is around 5.1 debit. (the debit will be
cheaper as OIH rallies up) Several reasons for this proposed
adjustment. OIH has moved quite a bit
away from the short 140p and no decay is being enjoyed by the trader.
By rolling down the short put spread closer to the money:
1. dampens the effect of time decay against the trader
Also, by reducing the put spread width from 10 to 5
2. frees up margin
3. moves OE(options expiration) breakeven point 5 points lower
4. this manuver does not add to max risk to the down side.
If the unbalnaced fly is filled for 5.0 debit, Max risk is still $1425, but the
breakeven at expiration is moved down to 128. With OIH moving up 2
points today, the position would be only 2 points away from OE BE.
Please note how the upside profitability is morphed into extending the
lower breakeven point further.
Proposed risk graph is shown.

9/28 The trader filled the unbalanced fly adj for 5.0 debit. OIH closed at 128.6.
10/20 final trade for the OIH case study posted 8/23, buy back
5x oct 130p at .25 each, locking in about a grand profit.
OIH, with 75 min to go for OCT expiration, its trading right at 130.
No need to take chances, and am 25cents away from max profit anyhow.

Thursday, October 26, 2006
No way in hell
No way in hell they fill me on either the nov/dec 2.5p calendars for .05 debit or even .10 debit.
I also sat on the dec/jan 2.5p calendars for several days, no dice. Its getting down to the wire on the FDA announcement. Stock down to 7.6 as of close today.
I also sat on the dec/jan 2.5p calendars for several days, no dice. Its getting down to the wire on the FDA announcement. Stock down to 7.6 as of close today.
Sunday, October 22, 2006
AVNR case study

AVNR FDA news pending 10/30. The vol and skew are large on all expirations and strikes. I did the attached diags on 10/30 for 1.0 credit. So far I have seen that same spread go as high as 1.4 a few days ago. Vega is pretty small. Risk Graphs generated using ThinkorSwim, of course.

Here is a simulation of -200% vol on all strikes, based on 10/22 higher vol. As long as stock does not tank below 6 I am golden by nov OE. Note the IVs for each leg has increased quite a bit since 10/13. Vega is still pretty small.

Here is what the skews on the 2.5p between dec/jan has gotten to.
I dont know if I can get a fill on this but it would be an awesome hedge for the downside if FDA gives the finger to AVNR on 10/30.
Subscribe to:
Posts (Atom)