my broker (www.thinkorswim.com) offers the possibility to view what
trades other customers enter and today (December 6th) someone entered
sell Jan 121 DIA put
buy Dec 121 DIA put
for a credit of 70 cents when DIA is at 123. Apart from the fact that
he might want to exit a position, let's assume he is opening this
position. Now I wonder, what is his rationale here?
In 10 days the December option is expired and he will be short the
January position. Anybody having an idea what this person is up to?
I guess if the market goes up, then he can buy back the short put
cheaper, but is that it?
thanks, gis
P.S. Many thanks to Ricky and options junky for answering my question
about the back ratio spread and the charts junky!!!
-------------------------------------------------------------
A:
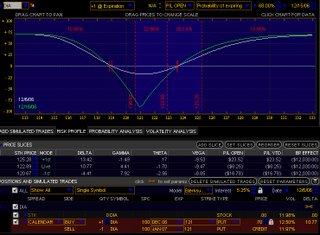
Its quite possible, as others have pointed out, this could be a part of a larger order or a rolling order. But suppose its an order to open a lone position, this is the risk profile, note how much margin is required, why is that?

A seemingly low risk looking risk graph above with large margin requirement is partly due to its vega risk. When the position is short volatility, an increase in IV hurts the overall position. In theory there is no ceiling on how high IV can go, thus the large margin. The other risk to the clearing firm is when the front month expires and the retail trader does nothing to terminate or cover the short jan leg.
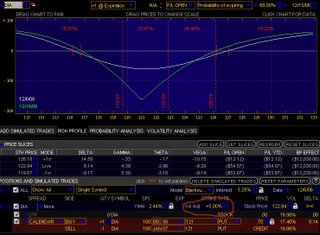
The graph below simulates a 5% increase in IV overall, note the max risk and breakeven now.

1 comment:
The margin is not really because of the vega risk. It is an example of the obsolete SEC margin regulations that in some cases like this have little to do with risk. There is no a plan to update these regulations to a risk-based system.
I like your graphs.
Neal
Post a Comment